The 10-year yield surged by 60 basis points in five weeks but may run out of steam by about right now.
By Wolf Richter for WOLF STREET.
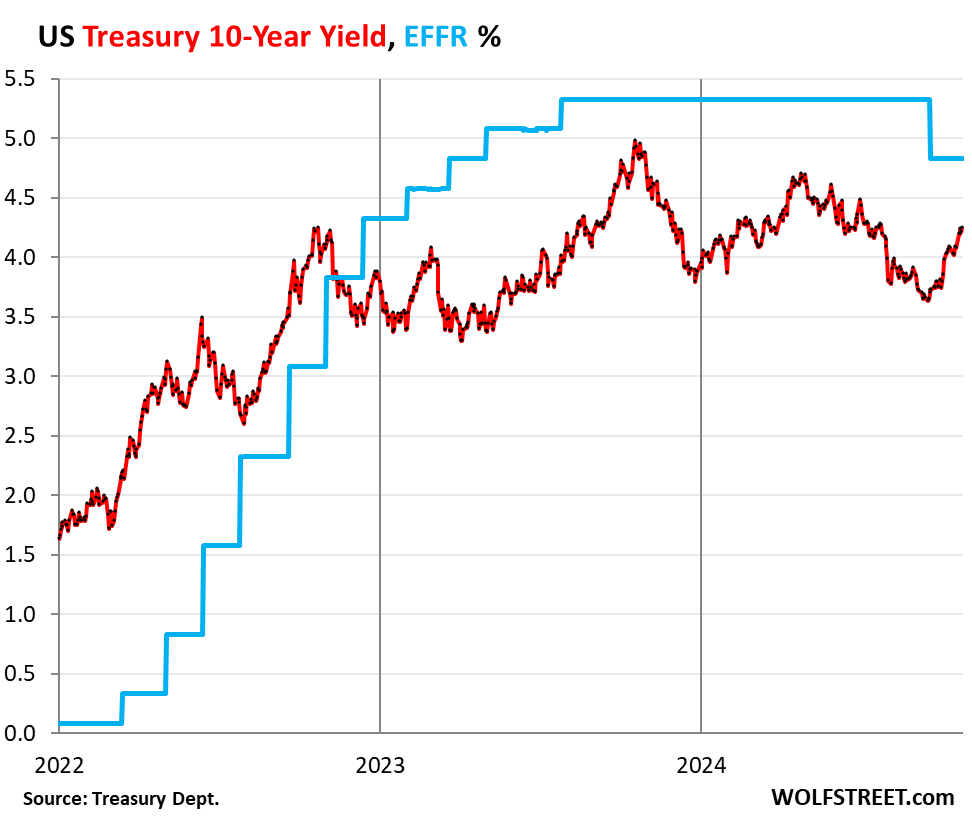
The 10-year Treasury yield rose to 4.25% on Friday, up by 60 basis points from the day before the Fed’s monster rate cut (when the 10-year yield was 3.65%), and up by 5 basis points from a week ago. This 4.25% is a milestone of sorts.
The 10-year yield has now reached the highest point since July 25. What a three-month round trip! On July 25, longer-term yields began to speed up their decline as the bets on Fed rate cuts kept gaining momentum on less-than-hot labor market data and cooling inflation, and kept declining until the Fed actually cut by 50 basis points on September 18, at which moment, to the surprise of many, particularly in the home sales industry, longer-term yields headed higher, instead of dropping further.
And about two weeks after the rate cut, the series of large everything-up-revisions started arriving, one after the other, a stronger labor market and higher and rising inflation. And yields spiked (blue = effective federal funds rate which the Fed targets with its headline policy rate):

But short-term yields have continued to decline, pricing in at least one 25-basis point cut this year, but are unconvinced about a second 25-basis point cut. Mega-cuts are off the table. And they’re pricing in cuts next year, but more slowly than a couple of months ago.
The “yield curve” has continued the process of un-inverting amid the simultaneous rise of longer-term yields and decline in short-term yields.
The normal condition of Treasury yields is that longer-term yields are higher than short-term yields. The yield curve is considered “inverted” when longer-term yields are below short-term yields, which started happening in July 2022 as the Fed rapidly hiked policy rates, pushing up short-term Treasury yields, while longer-term yields also rose but more slowly. The yield curve is now in the process of normalizing.
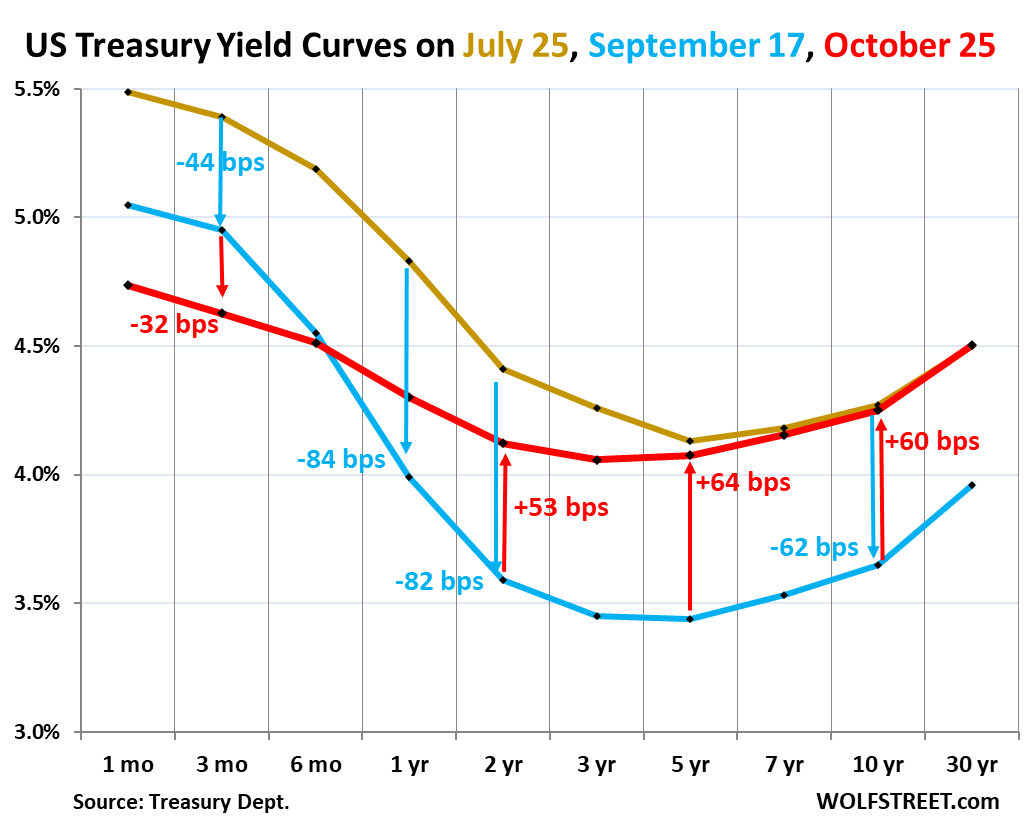
The chart below shows the “yield curve” with Treasury yields across the maturity spectrum, from 1 month to 30 years, on three key dates:
- Gold: July 25, 2024, before the labor market data went into a tailspin.
- Blue: September 17, 2024, the day before the Fed’s mega-rate cut.
- Red: Friday, October 25, 2024.

Yields from 7-year maturities on up are now (red) about where they’d been on July 25 (gold). This is the milestone.
And note by how far those yields have risen since the day before the rate cut (blue line). Everything from 3-years through 20-year yields has risen by 60 basis points or more. This was a big fast round trip, going down in two months, going back up the same distance in one month amid a lot of volatility in the Treasury market.
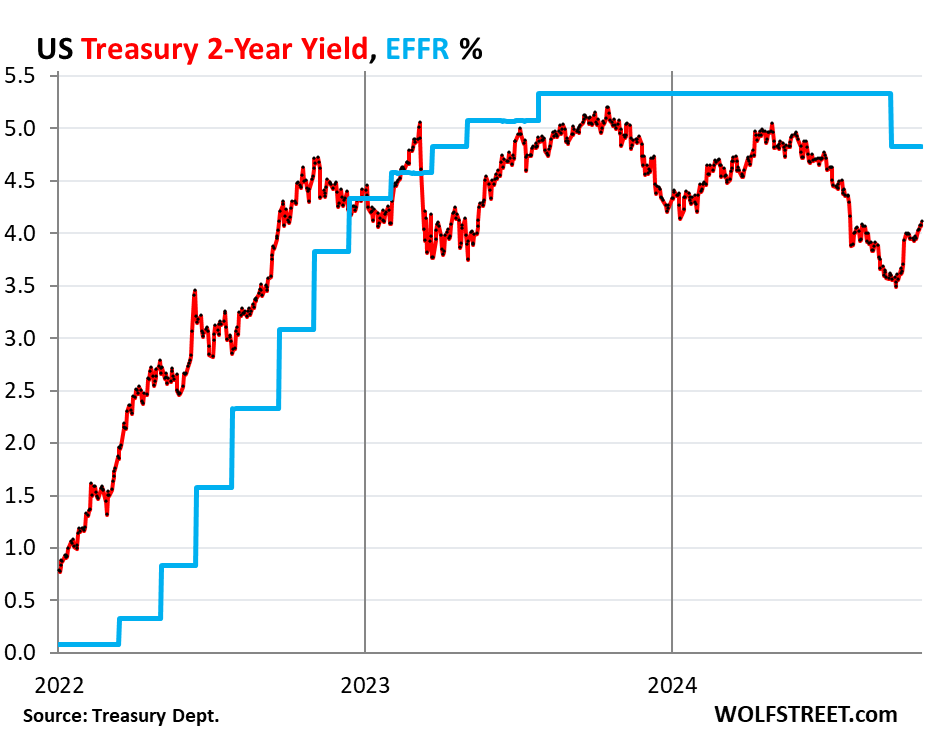
The two-year Treasury yield has been above 4% the entire week and on Friday closed at 4.11%, the highest since August 1. It has come up in part because the aggressive rate-cut expectations have been dialed back after the series of everything-up-revisions.

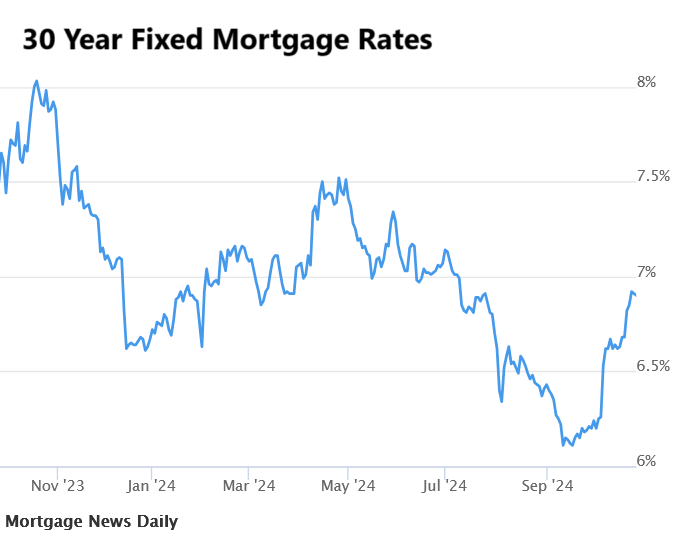
Mortgage rates, which roughly parallel the 10-year yield but higher, have spiked from the low-point just before the rate cut. The daily measure of Mortgage News Daily for the 30-year fixed rate mortgage has gone in a little over one month from the low of 6.11% on the eve of the rate cut to 6.90% now.
Mortgage rates in the decades before QE were normally above 6%, and for long periods above 7% to 8%, and there were years with much higher rates (chart via Mortgage News Daily).

For the real estate industry, this turn of events was very much unexpected. They promised buyers and sellers that mortgage rates, which had already plunged from near-8% a year ago to near-6% by mid-September without even a single rate cut, just on a wing and a prayer, would continue to plunge, and there was talk of 4% rates or whatever.
Despite the plunge in mortgage rates from the end of October 2023 through September 17, sales volume of existing homes wilted – because prices are too high. And over the past few weeks, sales volume has deteriorated further, as we can see from the drop in mortgage applications.
The problem with the housing market today – sales of existing homes in 2024 are on track to plunge to the lowest volume since 1995 – isn’t mortgage rates; they’re back to normal. It’s that home prices exploded, including by 50% or more in many markets in less than three years during the free-money era of the pandemic, in many cases on top of already precariously high prices.
These prices are too high, they’re not economically feasible, they don’t make sense. Seeing this, many buyers have gone on strike. But mortgage rates are now back in the normal range.
The drivers…
Longer-term yields, especially 10 years and longer, are driven by projections of inflation over the life of the security and by projections of supply of new Treasury securities to fund the huge deficits.
Inflation fears are big motivators. No investor wants to end up holding a Treasury security with 10-year left to run, and with a yield as purchased of 3.6%, when the average inflation rate over the life of the security is 4% or 5% or 6%.
A tsunami of supply of new Treasury securities is currently washing over the land every week to fund the deficits, and there is nothing to indicate that Congress and whoever is in the White House are even willing to have a serious conversation with the American people about this issue. So the debt has been ballooning recklessly, and bond investors aren’t seeing any relief on the horizon.
The Fed’s QT, a third factor that drives longer-term yields to some extent. The Fed switched to QT in 2022, after reckless rounds of trillions of dollars of QE, which had repressed longer-term yields and mortgage rates to record lows and had caused all kinds of mega-problems, including the crazy spike in home prices. By now, the Fed has shed nearly $2 trillion from its balance sheet. And QT continues despite rate cuts.
How much further can the 10-year yield go?
The 10-year yield has come up a lot, and fast, and our gut feeling is that it will run out of steam about right now.
If the next few inflation readings are benign, and the labor market data re-weakens, in that kind of scenario, the 10-year yield will likely back off.
But core CPI inflation has accelerated for the third month in a row on a month-to-month basis, and if it squiggles higher over the next few months, powered by continued strong demand and a solid labor market, the 10-year yield might try to climb up the steps some more, which would push mortgage rates back over 7%.
Enjoy reading WOLF STREET and want to support it? You can donate. I appreciate it immensely. Click on the beer and iced-tea mug to find out how:
Would you like to be notified via email when WOLF STREET publishes a new article? Sign up here.
![]()


