Literature review
Measurement of green finance
Although China’s green finance market was not officially established until 2007, a body of studies have attempted to measure the level of China’s green finance development. According to the methods used, these studies can be roughly divided into three categories. The first category, due to the data limitation, mostly uses a certain indicator such as green credit or green bonds as proxy variables19,20,26. As a single indicator cannot accurately reflect the actual development level of green finance, the second category tends to construct a comprehensive index using multi-indicators. For example, Bai et al.21 took green credit, green securities, and green investment as a comprehensive index. While Lee and Lee12 and Zhou et al.14 developed a comprehensive index considering green credit, green securities, green insurance, and green investment. Liu et al.4 established a comprehensive index including green credit, green securities, green insurance, green investment, and carbon finance. Xiong et al.24 constructed a comprehensive index, covering green credit, green insurance, green investment, and Green fiscal support. Overall, the existing comprehensive indices rarely include green funds and carbon finance. The third category usually adopts a policy evaluation framework, using China’s pilot projects related to green finance as policy shocks to measure the level of green finance development22,23, and most of which are measured at the provincial level. However, as China’s green finance policies are piloted based on cities, the existing policy evaluation literature based on provinces may overestimates the policy effects.
Evaluation of benefits of green finance
The emergence of green finance has innovatively connected environmental governance and financial development, attracting an increasing number of research to evaluate the effectiveness of this new financial tool in addressing climate challenges, which mainly focuses on four topics. (1) Green innovation and green productivity. Lee and Lee12, for example, found that green finance development significantly improves provincial green productivity in China. Zhou et al.22 concluded that green credit promotes green technology innovation by increasing liquidity, debt financing, and corporate profits, but which mainly exist in heavily polluting enterprises. However, the quality improvement of green innovation brought about by green credit is not always significant. Wang et al.13 argued that green finance positively affects green innovation in countries with lower level of green finance. Conversely, it negatively affects green innovation in countries with better green innovation or environmental performance. (2) Environmental performance27. Sun et al.28, for example, concluded that green finance could promote firm’s ESG performance, which is moderated by market concentration and social trust29. However, this positive impact on regional ecological efficiency is not obvious in general30, which varies for different levels of economic development14. (3) Carbon emissions15,21,28,31,32,33, and (4) Energy efficiency, energy intensity and energy structure optimization16,17,18,20,26,28. Most of these studies support the positive role of green finance in reducing carbon emissions and improving energy efficiency, however, the underlying mechanisms have not well-examined.
Hypothesis development
As summarized by Liu et al.30 and Wen et al.34, the development of green finance can lead to corresponding resource allocation effect and innovation-driven effect.
At the macro-level, through green financial product and instrument innovation, financial institutions can effectively utilize the resource allocation effect of finance systems and guide the capital flow to low-energy consumption and low-emission industries30. On the one hand, for example, by increasing the financing cost of energy-intensive industries and limiting their access to credit24, green finance can directly force these industries to reduce the production scale or exit the market21. On the other hand, according to the “signalling theory”, green finance can utilize the transaction prices in the securities market to transmit policy signals of green development to the public, further strengthening the guiding role of credit funds in promoting the participation of social capital in green industrial investment21. In other words, by channeling the flow of capital resources from high-emission and low-efficiency industries to low-emission and high-efficiency industries, green finance can play an important role in promoting the optimization and upgrading of industrial structure towards a more sustainable path21.
At the micro-level, although technological innovation is a high-investment and high-risk activity (Wen et al. 2024), green finance can induce innovation-driven effect by providing capital support and external supervision for green innovation activities of enterprises12,17,30. On the one hand, by reducing the financing cost of green projects through green credit and green bonds, or by providing a risk-sharing mechanism for innovation activities through green insurance33, green finance can create incentives for these enterprises to adopt cleaner production technologies, and investment in green innovation13,22. On the other hand, by incorporating environmental assessment into the decision-making process of investment and financing, finance institutions actually play the role of external regulator, which can force enterprises to enhance efforts in green technological innovation34. According to the “innovation compensation theory”, as a typical MBI, the technological innovation-driven effect triggered by green finance will offset the cost of environmental compliance, achieving a win–win situation in which environmental performance and economic performance are simultaneously improved21.
In summary, the resource allocation effect of green finance can promote the optimization and upgrading of industrial structure, while the innovation-driven effect of green finance can provide capital support and external supervision for technological innovation, which can ultimately enable an increase in the efficiency of economic output and/or a decrease in the scale of carbon emissions30. Drawing upon the above mechanism analysis, we propose the following two hypotheses:
Hypothesis 1
The development of green finance is conducive to the reduction of carbon intensity.
Hypothesis 2
Green finance reduces carbon intensity via two channels: industrial structure adjustment and technological innovation.
Policy background in China
To accelerate the transition of economic development towards a sustainable model, in 2007, the Ministry of Ecology and Environmental of China (MEEC), the People’s Bank of China (PBC), and the China Banking and Insurance Regulatory Commission (CBIRC) jointly issued the Opinions on Implementing Environmental Protection Policies and Regulations to Prevent Credit Risks, marking that the concept of green credit has officially become a major policy tool in China’s environmental regulation system. In 2012, the CBIRC issued the Guidance on Green Credit, which clearly proposed to promote banking and financial institutions to actively adjust their credit structure to support the transition and upgrading of the industrial structure. In 2016, Chinese seven ministries jointly issued the Guidance on Building a Green Finance System, which pointed out China’s definition of green finance and formulate an overall strategy framework for green finance development. In 2017, with the approval of the State Council, the Green Finance Reform and Innovation Zones (GFRIZ) were piloted in eight cities from five provinces, including Zhejiang, Jiangxi, Guangdong, Guizhou, and Xinjiang.
Following the introduction of the GFRIZ, China’s green financial products and services have developed dramatically. By the end of 2021, according the data from Ren et al.25: (1) the volume of green credit (domestic and foreign denominated green loans) exceeded RMB 15.9 trillion, marking a 33% increase compared to the previous year; (2) the stock size of green bonds reached RMB 1.16 trillion, with the scale of new green bonds (excluding green local government bonds) increasing by approximately RMB 607.24 billion; (3) the scale of green funds was close to RMB 800 billion, and the number of green-investment-related theme funds exceeded 50.
Compared to industrialized countries with mature financial markets, the development of China’s green finance is still in the early stage. However, under the strong leadership of the central government, China’s green finance system is distinct, functioning neither as an independently developed system nor as a purely market-based system, but a collaboration of financial institutions, enterprises, markets, and the government35. This government-led green finance system has several unique advantages in dealing with climate change issues (see Ren et al.25 for details).
Typical facts
Distribution and evolution of green finance development
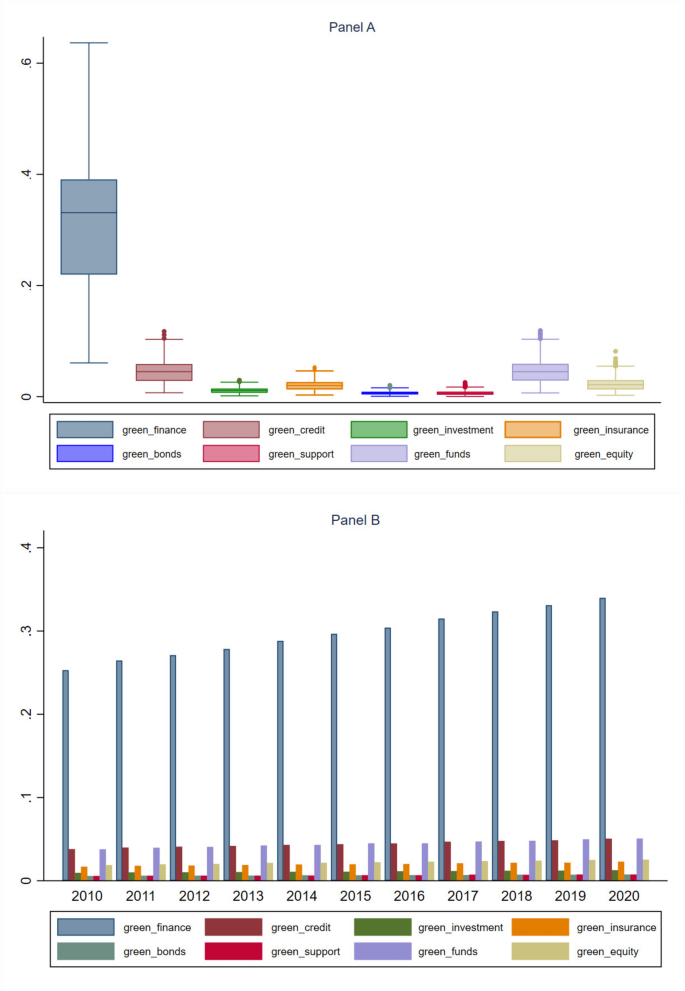
To capture the panoramic view and spatial evolution of China’s green finance development, we construct a comprehensive GF index by using 277 Chinese cities from 2010 to 2020 (see “Method and data” section for details). As show in Fig. 1, during the study period, GF index experienced a growth by 34.5%, with an average annual growth rate of 3.7%. However, the rapid development of green finance in China is mainly driven by green credit and green funds. Green bonds and green investment, on the other hand, have developed slowly, which are prominent shortcomings that constrain the development of green finance in China.
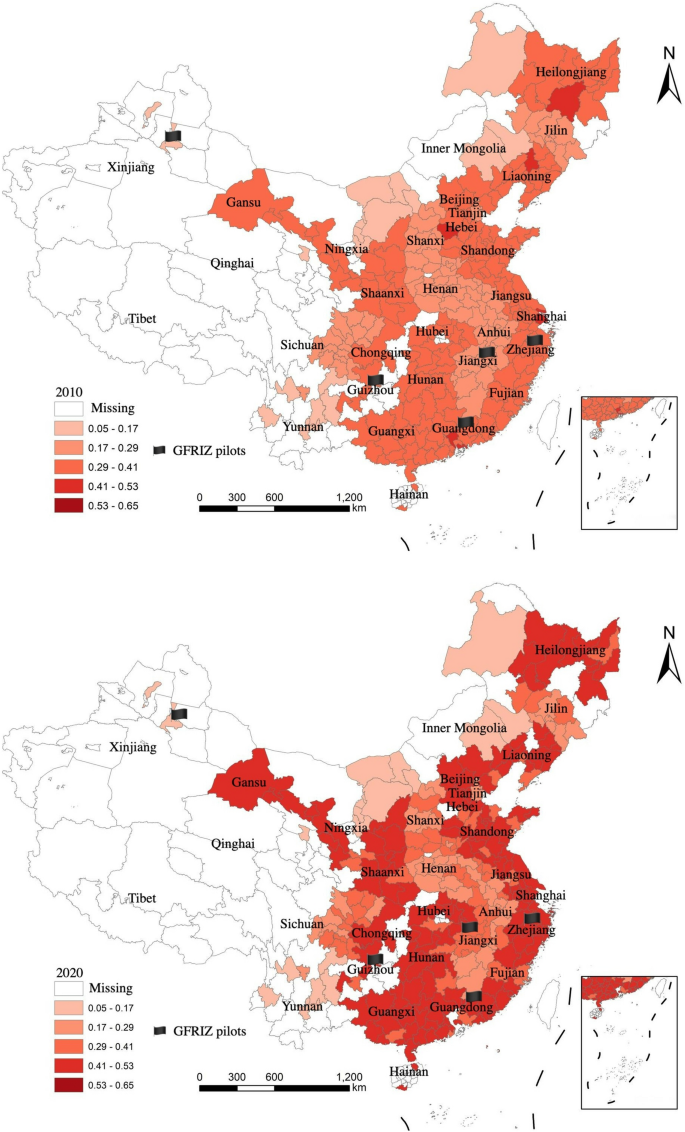
Although the bar graphs in Fig. 1 describes the annual evolution trend of GF index and the relative development level of the seven sub-dimensions, it cannot capture the spatial distribution characteristics between different cities well. To this end, we further plot the spatial distribution map of GF index using Arc GIS software. As shown in Fig. 2, darker colors indicate higher levels of green finance development. Overall, it presents three major characteristics: (1) Cities with high levels of green finance development are mostly distributed in the GFRIZ pilot zones and eastern coastal areas of China. Such as Shanghai (Eastern coastland), Guangdong (GFRIZ pilot & Eastern coastland), Heilongjiang, Hebei (Eastern coastland), Liaoning (Eastern coastland), Guizhou (GFRIZ pilot), Hubei, Shandong (Eastern coastland), Jiangsu (Eastern coastland), and Zhejiang (GFRIZ pilot & Eastern coastland) are the top ten provinces in the rankings. It indicates that a high correlation between green finance development and urban economic vitality and policy guidance; (2) Although the development level of green finance in each city has improved over the past decade, the spatial differentiation pattern between cities has persisted, or which even shows an expanding trend of polarization. Factors such as endowment, geographical location, and infrastructure constraints contribute to this pattern; and (3) In some urban agglomerations, such as Beijing-Tianjin-Hebei, the Yangtze River Delta, and the Pearl River Delta, green finance is showing a trend of spreading from core cities to surrounding cities.
Distribution and evolution of urban carbon intensity
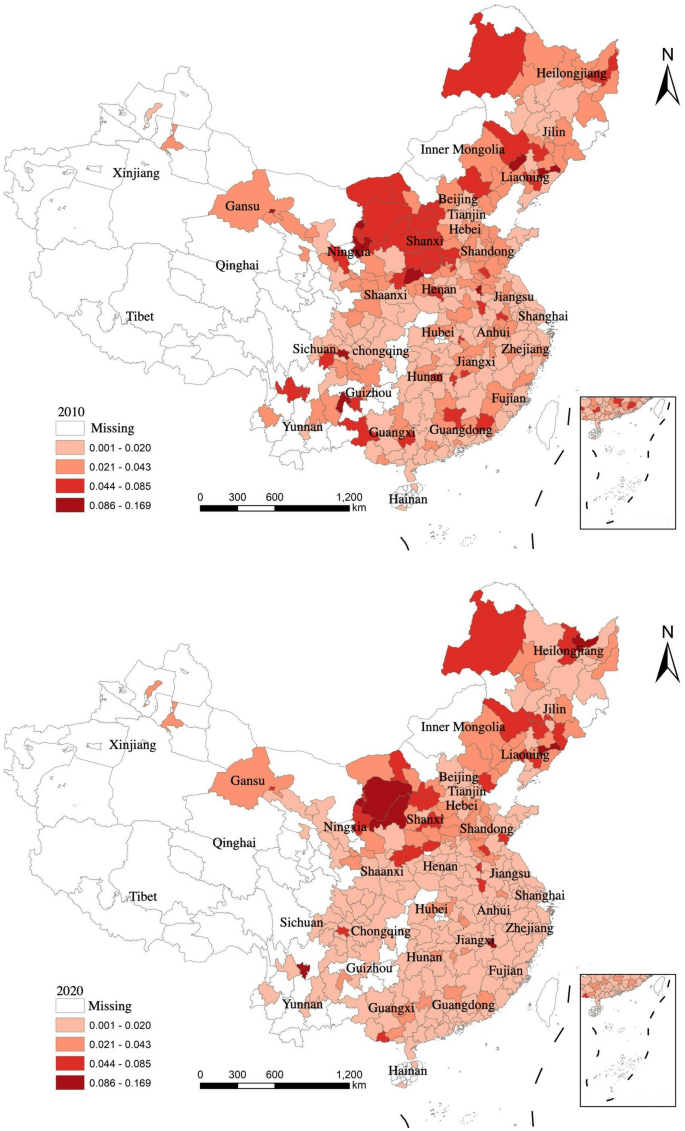
Similarly, as shown in Fig. 3, darker colors represent higher levels of carbon intensity (carbon emissions per RMB 10,000 Yuan of GDP). It can be seen that the carbon intensity of Chinese cities is decreasing over time, but showing a clear spatial pattern characterized by “high in the north and low in the south”. This pattern can be attributed to two reasons. On the one hand, as the cold winter climate, all northern cities need heating, with coal-fired boilers serving as the primary heat source in most of these cities. Despite the widespread development of “coal to gas/electricity” technologies in recent years36, coal-fired power still remains a significant source of power generation. On the other hand, many cities in the north, especially in the northeast region, are traditional old-industrial-bases, with the industrial structure dominated by high-energy consumption and high-emissions industries, such as automobile manufacturing, steel, metallurgy, chemical and building materials.


