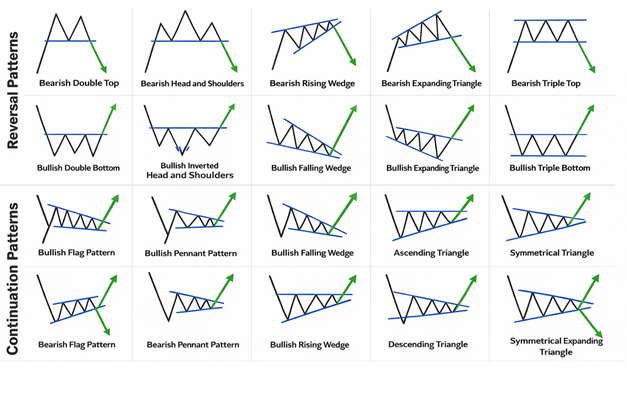
Most common trading patterns
Below are some of the most widely used and reliable trading patterns across financial markets.
Ascending triangle
The ascending triangle is a bullish continuation pattern.
Key characteristics:
- Flat resistance line.
- Rising support line.
- Increasing buying pressure.
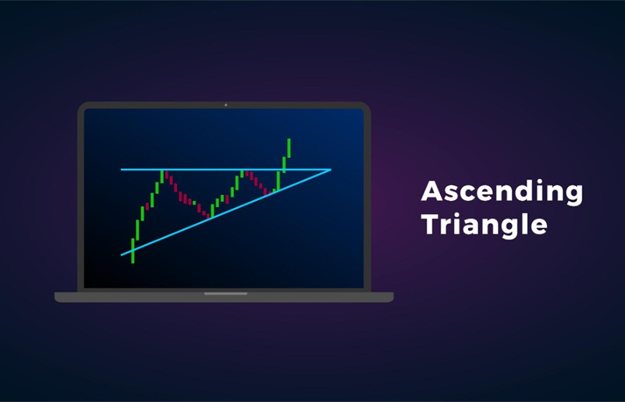
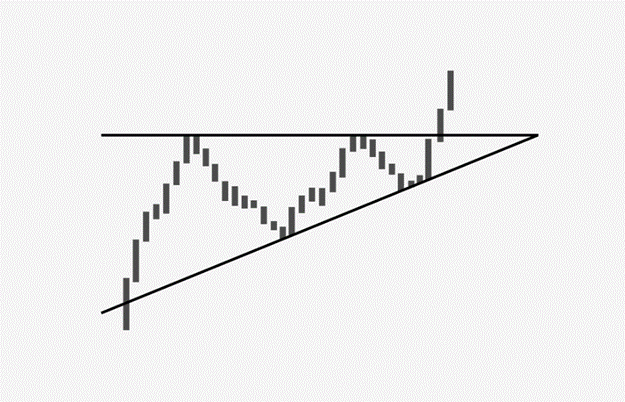
A breakout above resistance often signals continuation of the uptrend.
Descending triangle
The descending triangle is typically a bearish continuation pattern.
Key characteristics:
- Flat support line.
- Descending resistance line.
- Increasing selling pressure.
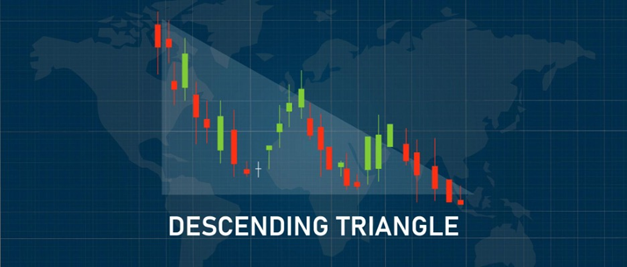
A breakdown below support often leads to further downside.
Symmetrical triangle
The symmetrical triangle forms when price compresses between:
- Rising support.
- Falling resistance.

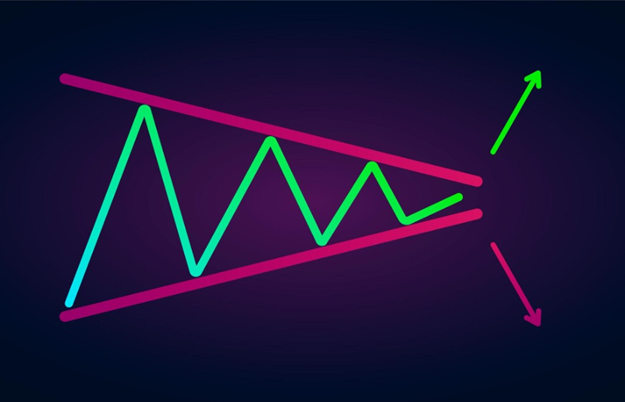
This pattern signals indecision, and breakouts can occur in either direction. Traders often wait for confirmation before entering.
Pennant
Pennants form after strong price moves and represent short consolidation phases.
Key characteristics:
- Sharp impulsive move.
- Brief consolidation.
- Continuation in the original direction.
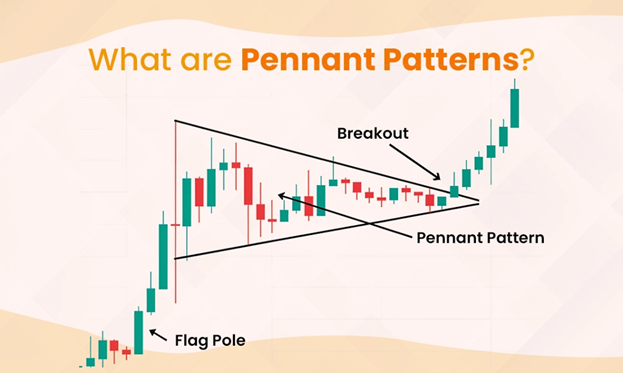
Pennants often appear in trending markets.
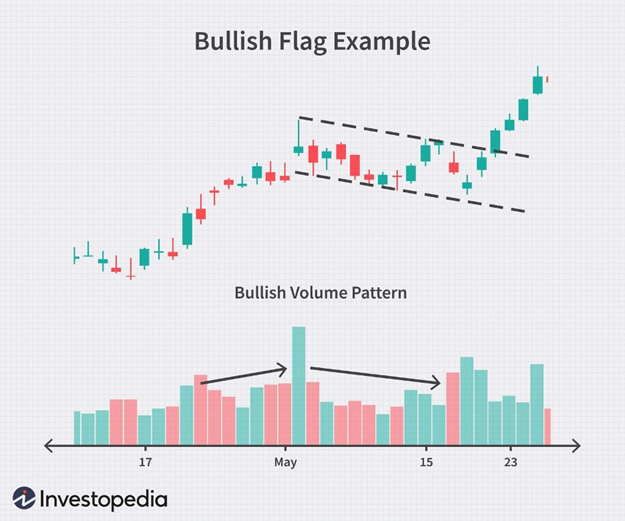
Flag pattern
The flag pattern resembles a small channel moving against the prevailing trend.
Despite the temporary counter-trend movement, the breakout usually occurs in the direction of the original trend, making it a continuation pattern.
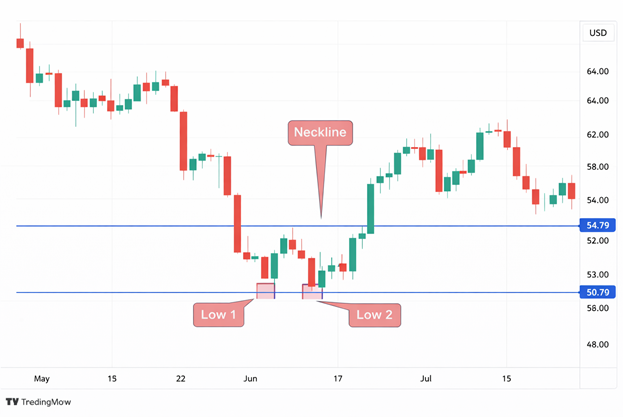
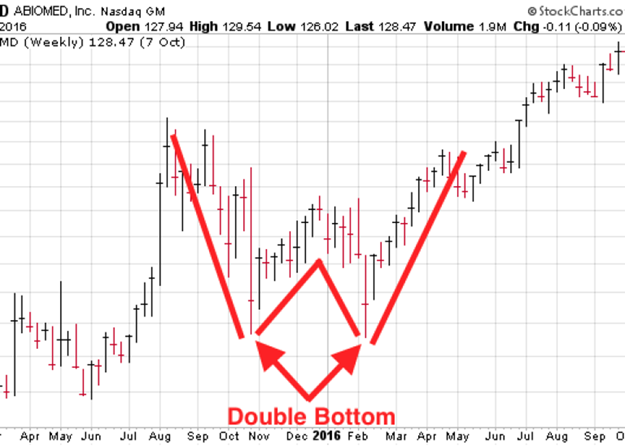
Double bottom
The double bottom resembles the letter “W” and signals a potential bullish reversal.
Key characteristics:
- Two failed attempts to break support.
- Increasing buying pressure.
- Break above resistance confirms reversal.
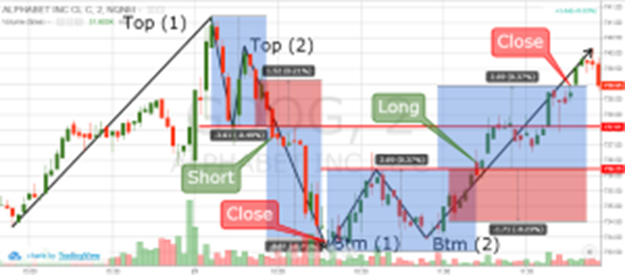
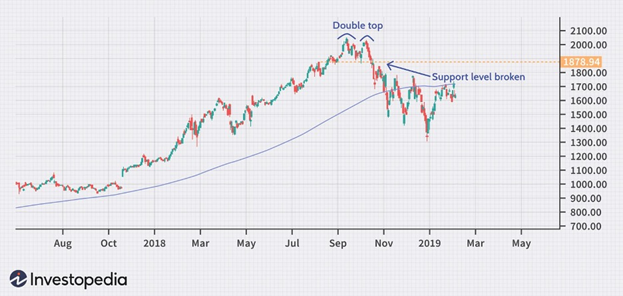
Double top
The double top resembles the letter “M” and signals a potential bearish reversal.
After two failed attempts to break resistance, price often reverses downward.
Download the full article here