Goverdhan Gajjala is a day trader who is also a software consultant working from home.
The flexibility of his day-to-day schedule opened a doorway to pick up stock trading as a side gig. But he initially began as a swing trader in 2019, holding stocks from days to months versus long term. This approach means the bulk of work is done in researching company fundamentals before buying a stock. But once a position is taken, a trader doesn’t need to monitor the screen continually and can go about their day.
While swing trading took less time out of Gajjala’s day, increasing his duration period in a stock also meant increased risk. Too many unknowns, including sudden news headlines, could pop up along the way and impact a stock’s price. This part of trading made Gajjala uncomfortable.
By 2021, he began exploring other methods to increase the control exercised on a trade. For him, this meant turning to day trading, where stocks are only held between seconds to hours but not overnight. This approach takes a different form. Rather than focusing on a company’s fundamental strengths, it’s focused on chart action and technical analysis. Here, the underlying company being traded is less important. But it also means watching a position until you exit.
To build his day trading skills, Gajjala took an online course with Mark Minervini, a veteran trader and a past winner of the US Investing Championship, an annual competition for traders. He joined the course’s private access program, a paid educational platform for trading stocks, and spent a year learning the content. He also read shared insights from chat rooms, tested stock scanners, and studied patterns from the day’s top movers.
His observations allowed him to learn how to recognize repeated patterns, especially from stocks with lower floats. In previous interviews with Business Insider, he shared his bull flag pullback trade. He also explained how he uses exponential moving averages (EMA) and broke down the characteristics of the stocks he picks. Altogether, Gajjala trades up to five patterns.
He tested his skills in 2023 when he enrolled in the US Investing Championship, where he finished first place with an 805% gain, according to monthly brokerage statements viewed by Business Insider and results vetted by the championship founder, Norman Zadeh.
In this interview, Gajjala explains another pattern he trades, which he refers to as a squeeze up or reversal.
Trading on a quick comeback
A reversal or squeeze up refers to a stock that has a quick comeback after a sharper sell
off.
Gajjala begins by finding the big movers of the day which his scanner picks up on. Regardless of which patterns he trades, the filtered stocks he looks for are as follows:
- Stocks up by more than 25% in premarket hours.
- Small caps with prices per share between $0.50 to $100.
- Volume traded above 1,000,000 to ensure enough liquidity.
He generally ends up with about five to eight stocks for the day. He then watches their charts for familiar patterns.
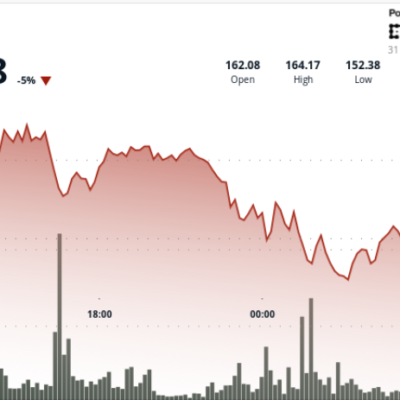
If a stock is likely to recover quickly from a price drop, it must demonstrate a few characteristics. A squeeze-up or reversal pattern requires strong demand, which is confirmed by the high-volume bars below the price chart.
Strong demand also means that the buying pressure will keep the price from falling and remaining low. On a chart, this will look like a quick sell-off or drop in price followed by a pullback from the plunge. Gajjala refers to the pattern as resembling a ball in water that is pushed down but pops back up once the downward pressure is removed.
The recovery is then followed by a period of consolidation, when the price action range tightens, signaling that the price is being digested. During this stage, Gajjala marks the support lines — where the price continually bounces back up — and uses it to set his stop loss.
During this period, the volume bars increase with upside price action. This signals that a breakout could follow. He noted that the entire pattern could play out within the span of a few minutes to an hour and a half.
This pattern requires enough volatility for price action. Therefore, these stocks must have low floats, less than 10 million, so buyers and sellers could impact price direction.
On July 7, 2023, PSQ Holding (PSQH) showed up on his scanner after it began to rally during pre-market hours. At 8:30 a.m., the stock’s price spiked, followed by a quick pullback that lasted for 30 minutes before the price recovered and entered a consolidation period. Gajjala entered a position at the end of the first consolidation period, purchasing shares between $21 to $22, according to records of his brokerage account. He sold his positions at $26. He then continued weaving in and out of the same trade by adding to his position after shorter periods of additional pullbacks and consolidation, and selling at peaks.
Below is a chart demonstrating the first pullback and recovery followed by additional repeated reversals.
Thinkorswim