A trend we watch: As refis rose from collapsed levels, the Fed’s QT of MBS increased for the fourth month in a row.
By Wolf Richter for WOLF STREET.
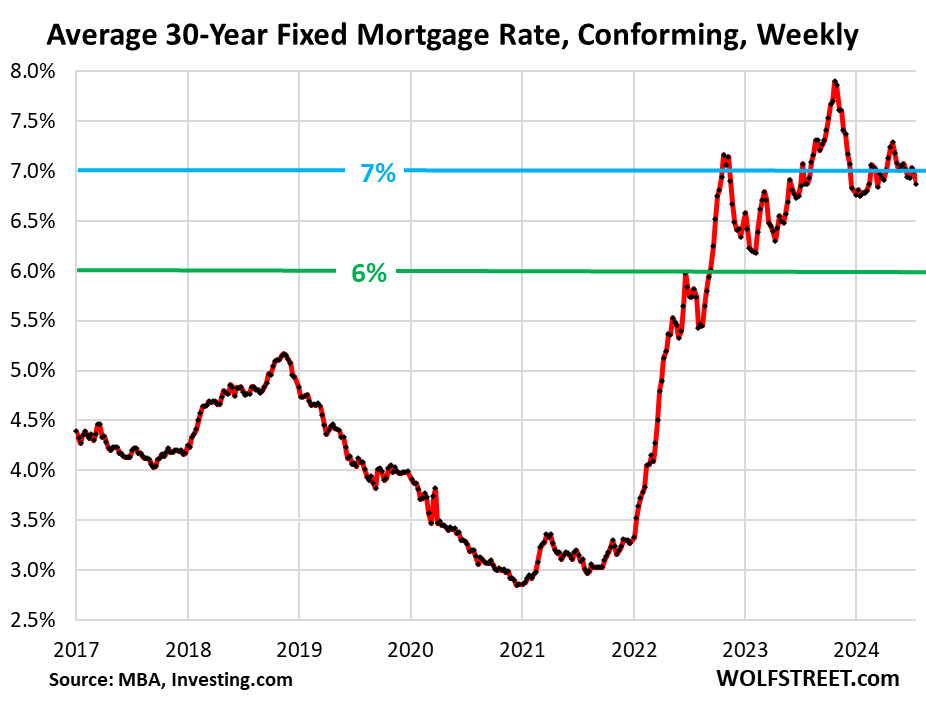
The average conforming 30-year fixed mortgage rate during the latest reporting week dropped to 6.87%, the lowest since mid-March, according to the Mortgage Bankers Association today. Not so ironically, two things happened, as the MBA also reported today:
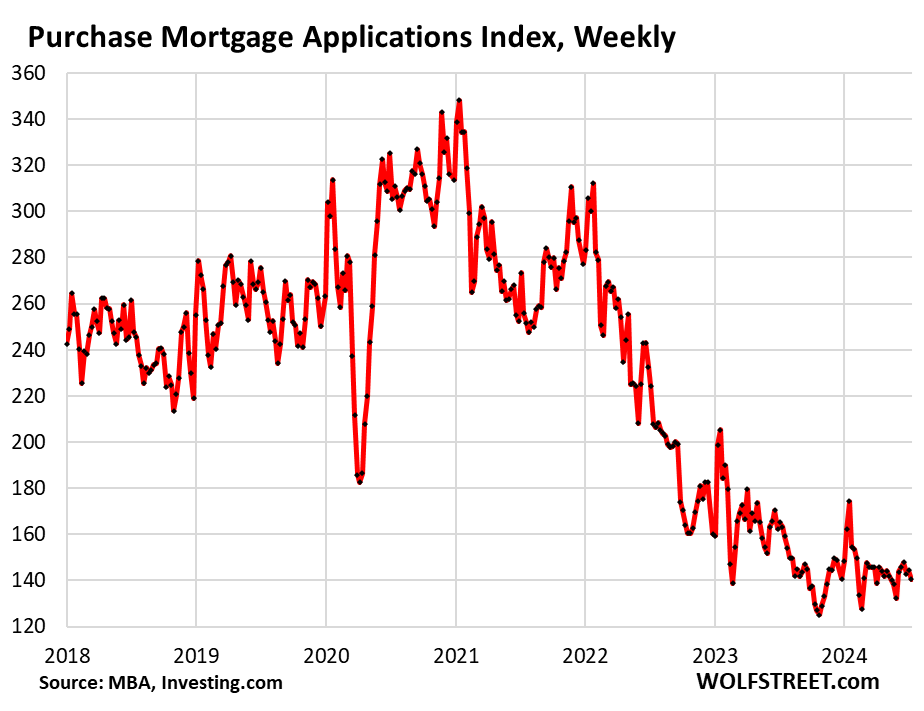
- Applications for mortgages to purchase a home fell to the lowest point since early June, as potential home buyers remained on strike, waiting for lower prices and lower rates.
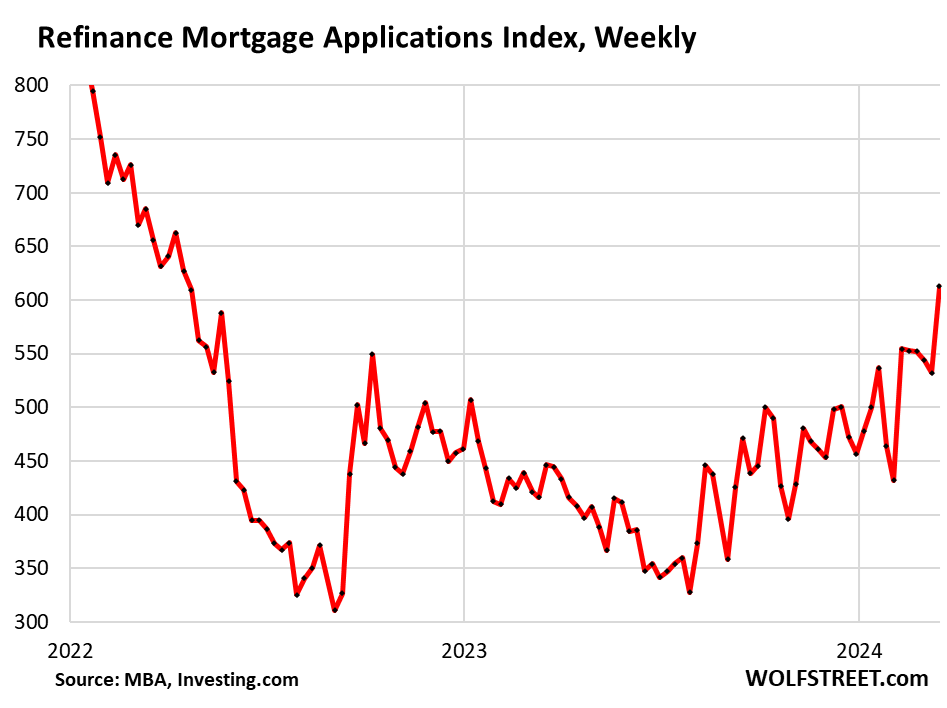
- Applications to refinance an existing mortgage jumped to the highest since August 2022 and have nearly doubled from the collapsed levels last November, with implications for the Fed’s QT.
The give-or-take 7% mortgage rate has been a fixture in the housing market since July 2023, briefly reaching 7.9% in October 2023. It has been above 6% since September 2022.

The problem isn’t mortgage rates, the problem is home prices. A 7% mortgage rate used to be a good deal. From 1970 through 2001, mortgage rates ranged from 7% to 18%. Relatively lower home prices made those higher mortgage rates work.
But when mortgage rates dropped as low as 5.5% in 2005, they fueled Housing Bubble 1, which led to the Housing Bust from 2006-2012. Mortgage rates dropped below 5% in 2010, then ranged mostly between 3.5% and 4.5% until 2020, when they plunged to 2.5%. These mortgage rates, especially the 3% mortgage rates during the pandemic, caused mindboggling home price increases, and those home prices don’t work with anything other than 3% mortgages – and not even with them.
Buyers’ strike continues, prices are too high.
Home prices are simply too high even for cash buyers, home purchases have dropped, and home purchases requiring a mortgage have collapsed by nearly half from their pre-pandemic levels in 2019.
Mortgage applications to purchase a home in the latest reporting week fell to the lowest level since early June 2024, were down 14% year-over-year and down 47% from the same week in 2019.
Mortgage applications are an early indication of home sales volume, and sales volume is dismal, even as active listings have risen to multiyear highs. In November 2023, mortgage applications hit the lowest levels in the data going back to 1995.
This is a clear indication that potential buyers are holding out for lower prices and lower mortgage rates, they’re still on buyers’ strike, even as sellers are getting more eager to sell – hence the rising inventory and price reductions.

Mortgage refi applications jump from collapsed levels.
Mortgage applications to refinance a home began to collapse in 2022 when mortgage rates surged. Non-cash-out refis have nearly vanished. Most of the refis that are taking place are cash-out refis, according to data from the AEI Housing Center.
But looking at it with a microscope, we can see that refi volume has been trending up from the collapsed levels since November 2023, and in the latest reporting week jumped to the highest level since August 2022, having nearly doubled from November 2023.
Just guessing here, it looks like an increasing number of homeowners wanting to do a cash-out refi have been trying to outwait the 7% mortgage rates, thinking for months or for a year that this too shall pass, but now this too still hasn’t passed, and they cannot wait any longer, and they pulled the trigger:

As Fed watchers here…
We keep an eye on refis because an increase in refi activity increases the pace of QT with regards to the Fed’s MBS holdings. MBS come off the balance sheet when the underlying mortgages are paid down or are paid off. In a refi, the old mortgage is paid off, and the principal is passed through to MBS holders. The pace of the MBS QT was running at about $14 billion a month in early 2024, reflecting the historic lows of refi applications in November.
But the pace of MBS QT has ticked up for the fourth month in a row to $19 billion in June, reflecting refi applications through about April. The current jump in refis won’t show up on the Fed’s balance sheet until the passthrough principal payments from the paid-off old mortgages reach the Fed.
Refis and rates, the longer view…
Refi applications are still down by 66% from the same week in 2019 and 81% from the same week in 2021. Refis are a function of mortgage rates, going dramatically in the opposite direction of mortgage rates. The chart shows this inverse relationship between refi applications (red) and mortgage rates (blue).

Enjoy reading WOLF STREET and want to support it? You can donate. I appreciate it immensely. Click on the beer and iced-tea mug to find out how:
Would you like to be notified via email when WOLF STREET publishes a new article? Sign up here.
![]()


